The association of the spike protein IgG levels and peak disease severity
Introduction
The goal of the study was to examine the association of the spike protein IgG levels and peak disease severity, adjusting for gender and days since symptom onset.
Methods
Data
We used the COVID_immune data set, in which we focused the analysis on age, gender, spike IgG measurements, days since symptom onset and peak disease severity. To ensure the independence of our observations, we only keep the first measurement for each subject. Observations that include missing values were removed. Note that we log-transformed the dependent variable since it is positively skewed. Both the log scale and original scale spike IgG measurements will be reported.
Statistical methods
A two-way analysis of covariance (ANCOVA) was used to test for differences of means between three peak disease severity levels (mild/asymptomatic, moderate, severe) in spike IgG. We included gender as the factors and days since symptom onset as a covariate. The dependent variable is the level of spike IgG. Firstly, we checked the effect of interactions by partial F tests and dropped interactions that appeared to be not significant (p > .05). Then we compared levels of peak disease severity using adjusted means and tested for differences among the disease severity categories using Tukey’s range method. Finally, we conducted model diagnostics to check that model assumptions are reasonably met and check for outliers. Analyses were conducted using R software version 4.0.4.
Results
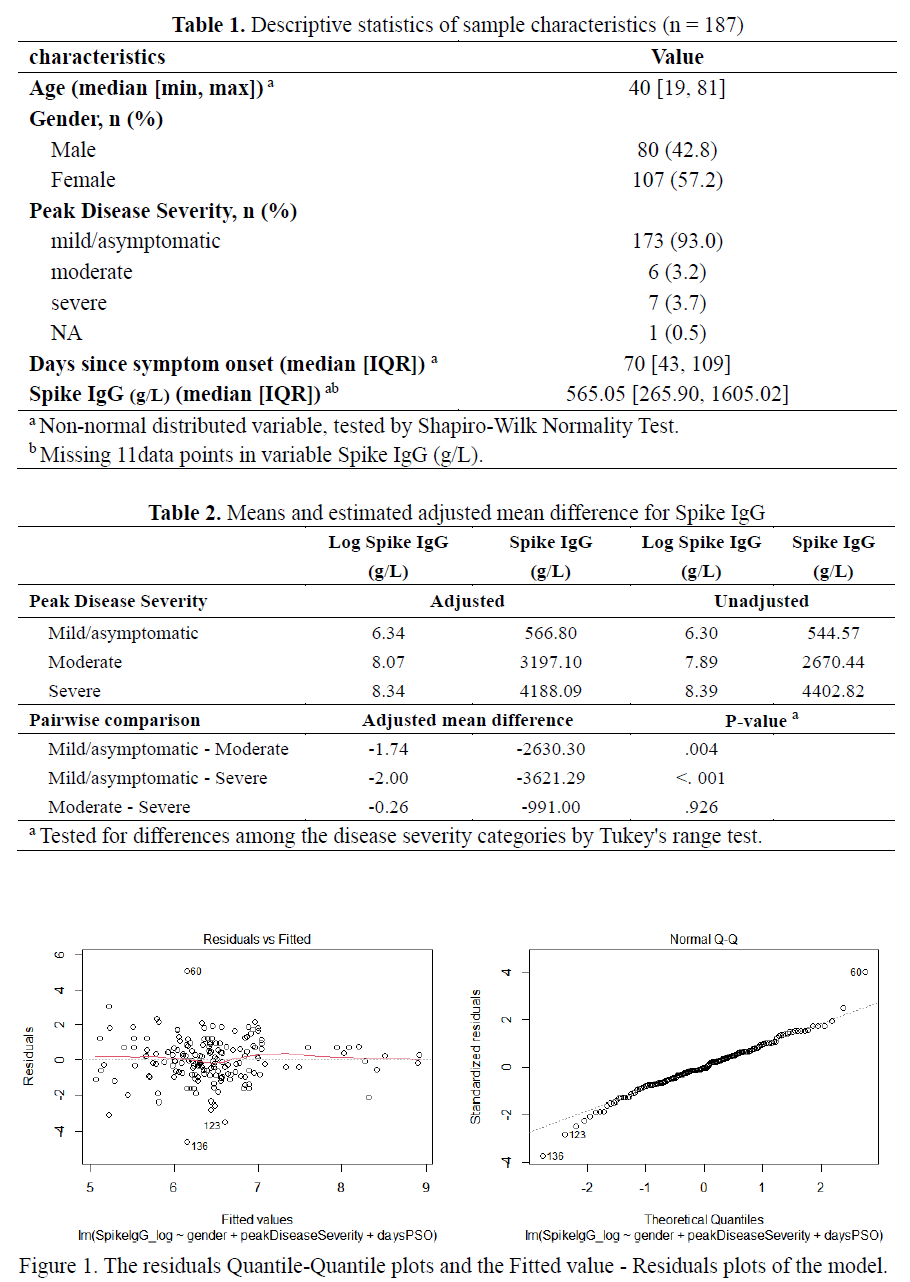
In total, the data set contains 239 observations for 187 patients, and 175 observations were included in the two-way ANCOVA model. Table 1 shows the descriptive statistics of sample characteristics for all 175 patients. The results of partial F tests suggested that interactions do not affect the level of spike IgG significantly. Thus, we obtained means adjusted for gender and days since symptom onset and fitted the ANCOVA model different peak disease severity. Table 2 presents the adjusted and unadjusted means and estimated adjusted mean difference for Spike IgG. The adjusted mean log scale Spike IgG between mild/asymptomatic and moderate in peak disease severity was found to be statistically significant different (p = 0.004), and that between mild/asymptomatic and severe in peak disease severity appeared to be significantly different as well (p < .001). For the model diagnostics, we tested the linear model assumptions. Figure 1 shows that the residuals were left sightly skewed and variances were not constant, while conditional means follows a line.
Discussion
In this analysis, we found that the adjusted mean Spike IgG was significantly different between peak disease severity levels, adjusting for gender and days since symptom onset. Log-transforming the Spike IgG improved the normality and constant variance for the model error term. Nevertheless, results of model diagnosis indicates that there is likely a small number of outliers, which require further research.
Appendix