Effectiveness of Mindfulness Awareness Practices intervention
Introduction
The goal of the study was to compare Mindfulness Awareness Practices (MAPs) intervention with no intervention on their ability to reduce the depressive symptoms. We also explored the association between the demographic, medical and psychosocial characteristics with depressive symptoms at baseline.
Methods
In this study, we included demographic, medical and psychosocial characteristics as independent variables. Demographic variables consisted of study site (Los Angeles, CA; Baltimore, MD; Boston, MA.), age at baseline test (years), age at diagnosis test (years), Time since diagnosis (years), marital status (Married/living with partner; Not Married), annual household income (Under 60,000; 60,000-100,000; 100,000 or more; NA), BMI, employed status (Yes; No) and whether white race (Yes; No). Medical variables contained whether participant had a mastectomy and whether participant had a neoadjuvant chemotherapy. Psychosocial characteristics consisted of Insomnia severity index (ISI) at baseline and Fatigue Severity Index (FSI) at baseline. Dependent variable is Center for Epidemiologic Studies-Depression (CES-D).
Baseline differences between the control and each intervention group were assessed using chi-square, Fisher exact test, Wilcoxon rank sum test and two sample t tests. Center for Epidemiologic Studies-Depression (CES-D) at baseline as the dependent variable was examined using hierarchical multiple linear regression analyses. The demographic variables age at baseline, race, employment and marital status were entered on Step 1. Two more variables about medical history (mastectomy and neoadjuvant chemotherapy) were tested in Step 2 to help determine the unique contribution of each subscale. Insomnia severity index and CES-D at baseline were added in Step 3 to determine the contribution of them as well as their effect on the other variables in the model. Outcome comparisons were made between intervention group and control group. We conducted preliminary analyses, in which we defined participants with either missing CES-D or invalid CES-D as the inevaluable and conducted attrition analysis on valuable and inevaluable participants for the baseline characteristics. We compared baseline differences between participants using chi-square, Fisher exact test, Wilcoxon rank sum test and two sample t tests. Then, we fitted a model to estimate the effectiveness of the intervention on CES-D, adjusted for baseline CES-D and variables which are different between evaluable and inevaluable groups at the p < .05 level in the preliminary analysis. Finally, we conducted model residual diagnostics to ensure that the model assumptions are reasonably met and identify any unduly influential observations. Analyses were conducted using R software version 4.0.4.
Results
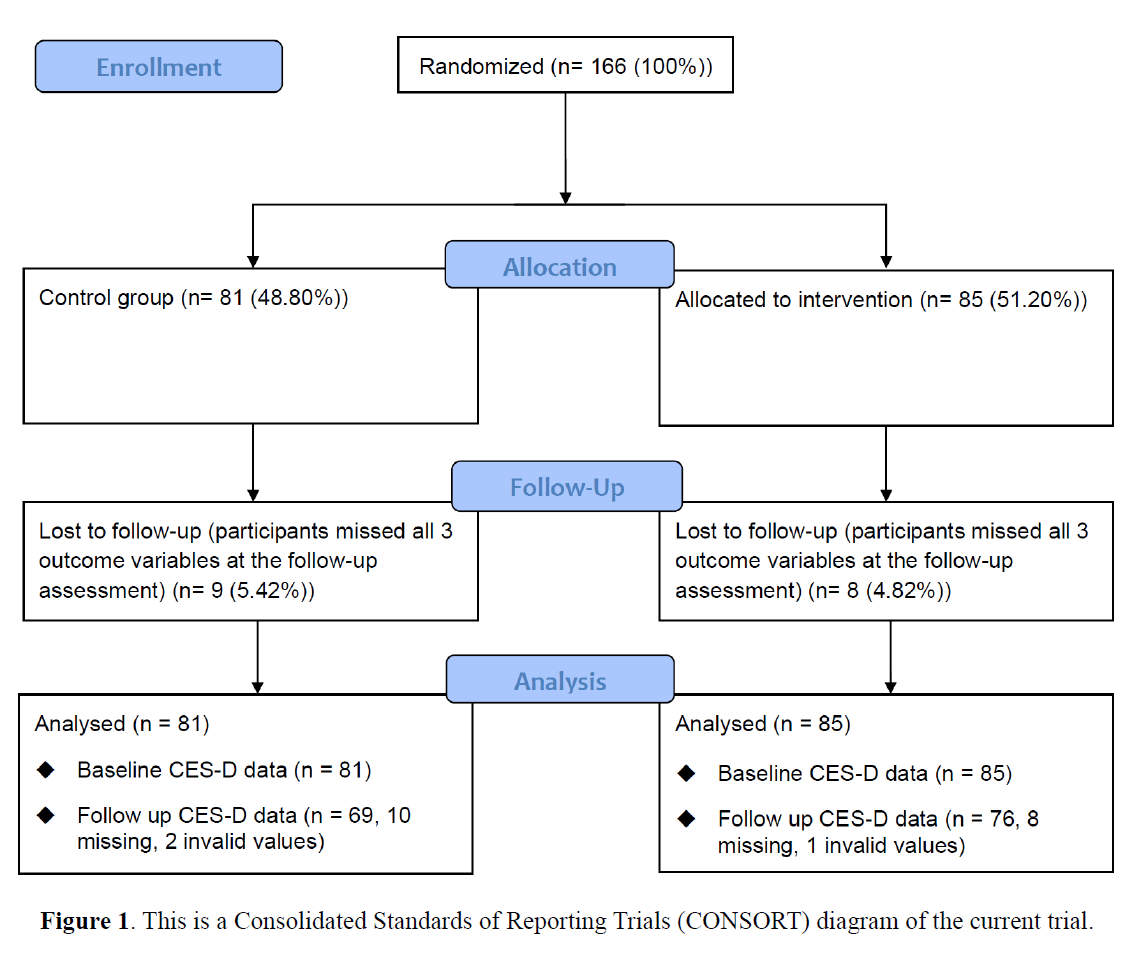
Figure 1 shows details of participants’ recruitment and movement through the study. In total, 166 individuals completed the baseline assessment and were randomized to one of the intervention methods, and 149 participants (89.76%) completed the entire study, which included the final follow-up assessment. Among 85 (51.20%) participants who were randomized to receive interventions, 8 (4.82%) people did not complete the follow-up assessment. Of the 81 (48.80%) participants received no interventions, 9 (5.42%) people were lost to follow-up. In total, 18 participants were lost follow up CSE-D score and 3 participants had invalid CSE-D score, which is out of the score range (0-60).
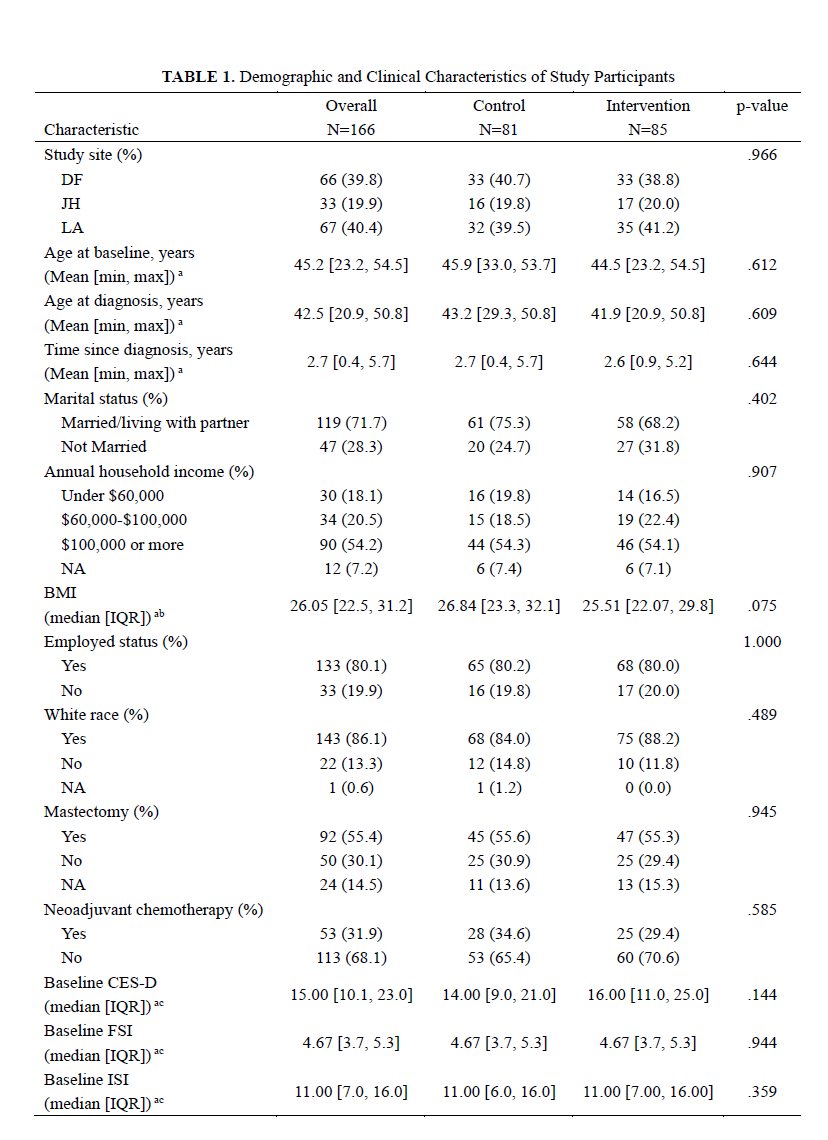
Table 1 presents the summary of participants’ demographic characteristics, medical statuses, and baseline psychosocial scores regarding intervention conditions, which suggested that there were no significant differences between intervention and control groups at baseline. In addition, participants who were lost to follow-up Center for Epidemiologic Studies-Depression (CES-D) survey have no significant difference with those completed the entire study, in terms of demographic characteristics, medical statuses, and baseline psychosocial scores.
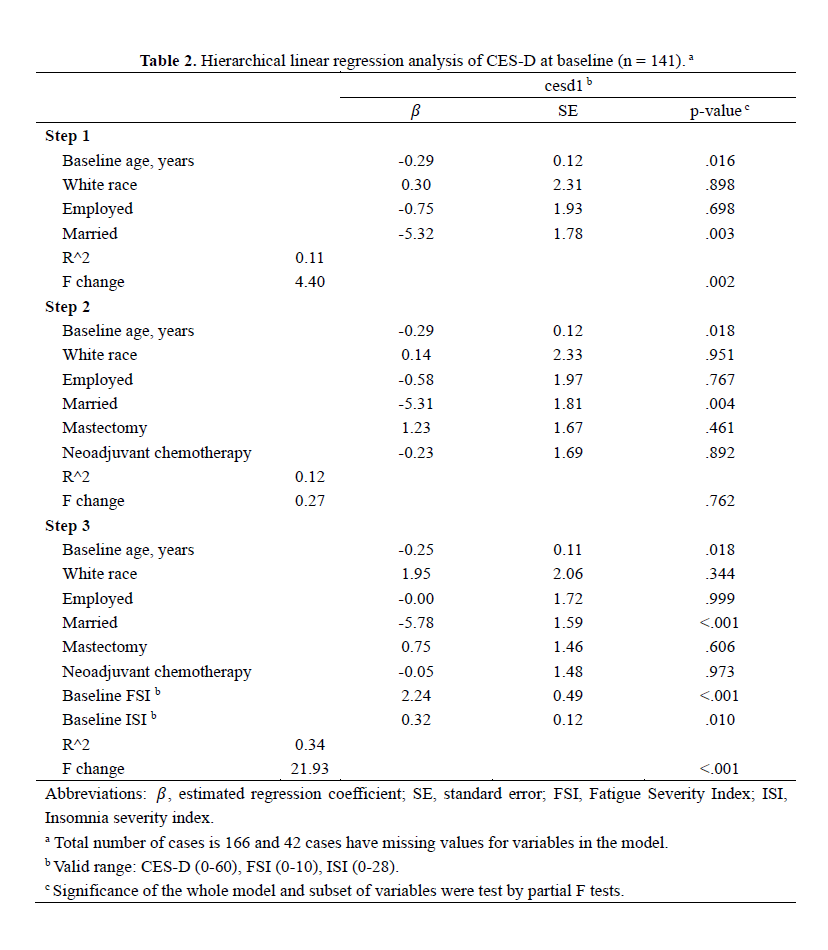
Table 2 shows the summary of hierarchical linear regression analysis of Epidemiologic Studies-Depression (CES-D) at baseline. In step 1 of hierarchical multiple linear regression analyses, age at baseline was shown to have a significantly negative correlation with CES-D (p = .016), and married individuals also appeared to have a significantly lower CES-D (p = .003). In Step 2 of the multiple regression analyses, after adding mastectomy and neoadjuvant chemotherapy status to the model, age at baseline test (p = .018) and marital status (p = .004) were still associated with CES-D significantly. In step 3, after including baseline Insomnia Severity Index (ISI) and Fatigue Severity Index (FSI) to the model, the addition of the two variables was shown to be significant in the model according to a partial F-test (p < .001). In addition, baseline FSI was positively associated with baseline CES-D significantly (p < .001), and ISI at baseline also appeared to have a significantly positive correlation with baseline CES-D (p = .009). Model 3 also indicated that age at baseline (p =.018) and marital status (p < .001) remained significant, when additionally controlling for baseline FSI and ISI.
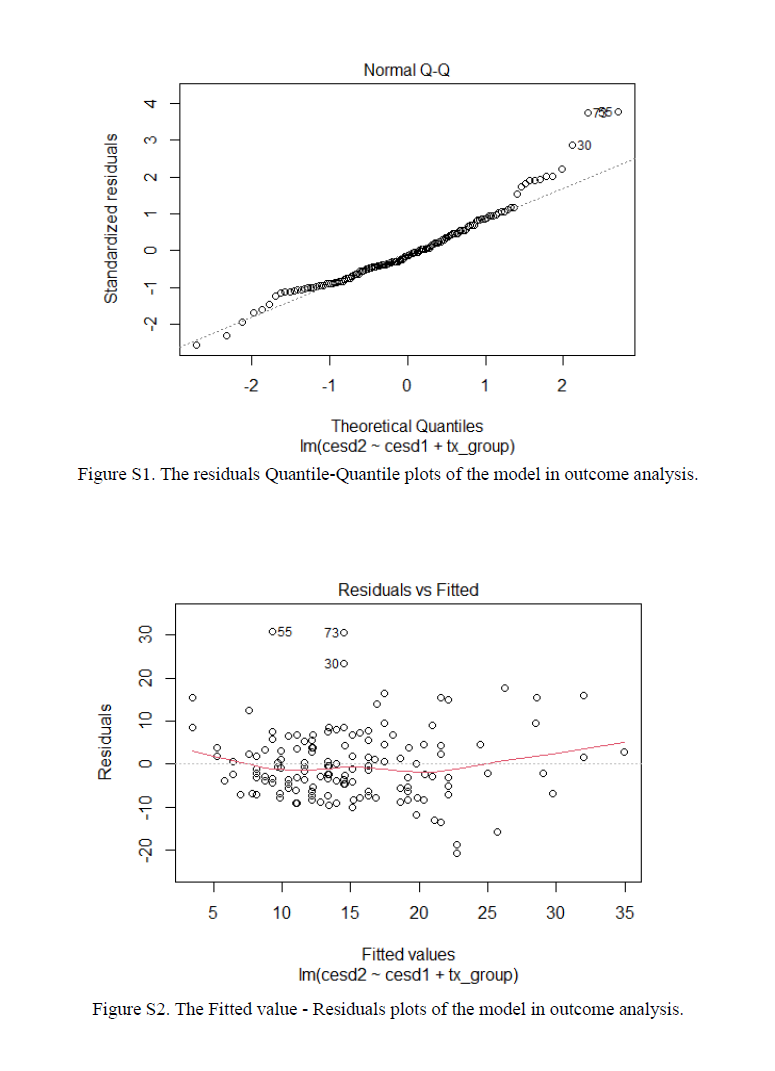
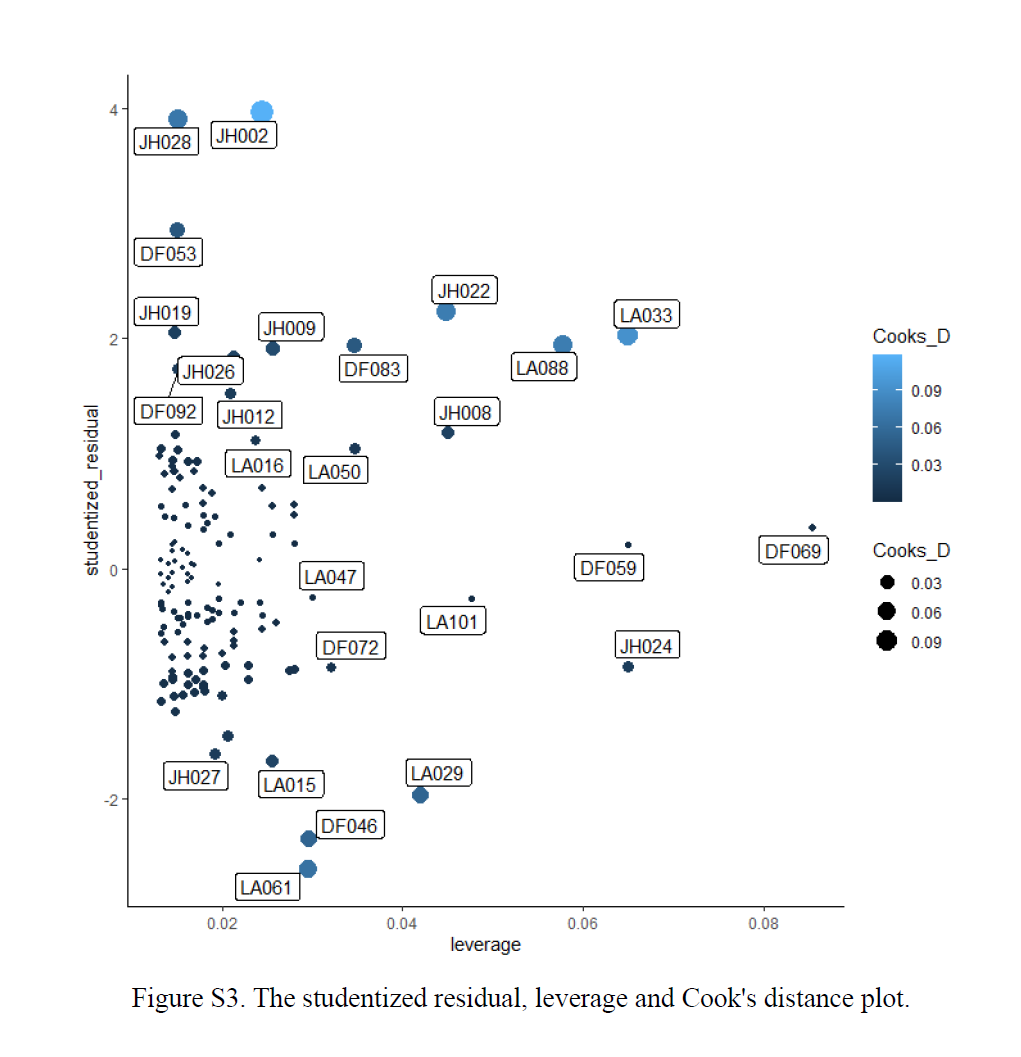
In total, 21 (12.65%) participants were inevaluable at follow-up due to missing or invalid outcome data (CES-D at follow up). Since there were no significant differences between participants who lost to follow-up and participants who finished the entire study at baseline, we only controlled for the baseline CES-D in the outcome analysis. The analysis indicated that the participants in the intervention group had mean CES-D that were 4.04 (SE = 1.38) points lower than the control group, controlling for baseline CES-D (p = .004). As for the model diagnostics, the residuals were left skewed sightly (Figure S1) and conditional means did not follows a line (Figure S2), while variances were largely constant (Figure S2). Figure S3 shows the model’s studentized residual, leverage and Cook’s distance by id, indicating that indicating that there is likely a small number of outliers.
Appendix